- Skew distorts hedge ratios
- MAD = $7.50
- Stock is 50/50 to move up or down by $7.50
- 1-day SD = 9.375% (ie 1.25 x 7.5%)
- Implied volatility you’ll see in your Black-Scholes calculator: 148.5% (ie 9.375% x )
- Up scenario = P(up) * delta = 50% ($7.50 - $7.50) / $7.50 = 0
- Dn scenario = P(dn) * delta = 50% ($7.50 - $7.50) / -$7.50 = 0
- MAD = $7.50
- Stock is 75% to go up $5
- or 25% to go down $15
- 1-day SD = 9.375% (ie 1.25 x 7.5%)
- Implied volatility you’ll see in your Black-Scholes calculator: 148.5% (ie 9.375% x )
- Up scenario = P(up) * delta = 75% ($5.00 - $7.50) / $5.00 = -.375
- Dn scenario = P(dn) * delta = 25% ($15.00 - $7.50) / -$15.00 = -.125
Imagine a $100 stock that has a $7.50 0DTE straddle on earnings day
The balanced case: stock is 50/50 to move up or down $7.50
What’s the straddle’s delta?
The straddle has zero delta. The call and put deltas are the same magnitude (but the put delta is negative so the straddle delta is zero).
Showing my work
In general:
Delta = Δ straddle Δ in stock price
To compute this we take the weighted average of the up and down deltas:
Delta = Up Delta + Down Delta
The skewed case: stock is 75% to go up $5, 25% to go down $15
Note that the straddle is still fairly priced at $7.50 (ie 75% x $5 + 25% x $15)
Suppose you only see the ATM straddle price. You don’t know the stock the distribution is actually skewed.
The following 2 parameters will look the same as the balanced case:
What’s the straddle’s delta?
This is a bit tricker. See the Showing my work above and follow the pattern.
The delta of the straddle is -.50!
In other words, it’s the delta you’d expect for the ATM put alone. In this example the put has a .75 delta and the call has a .25 delta.
See the work
Net delta: -.50
This straddle’s delta is utterly dominated by the put’s delta. Even though the put and call are both worth $3.75 the put has a -.75 delta and call has a .25 delta yielding a net delta of -.50.
This negative skew might remind you of the positive skew example where ATM calls in a high volatility name have much higher deltas than .50!
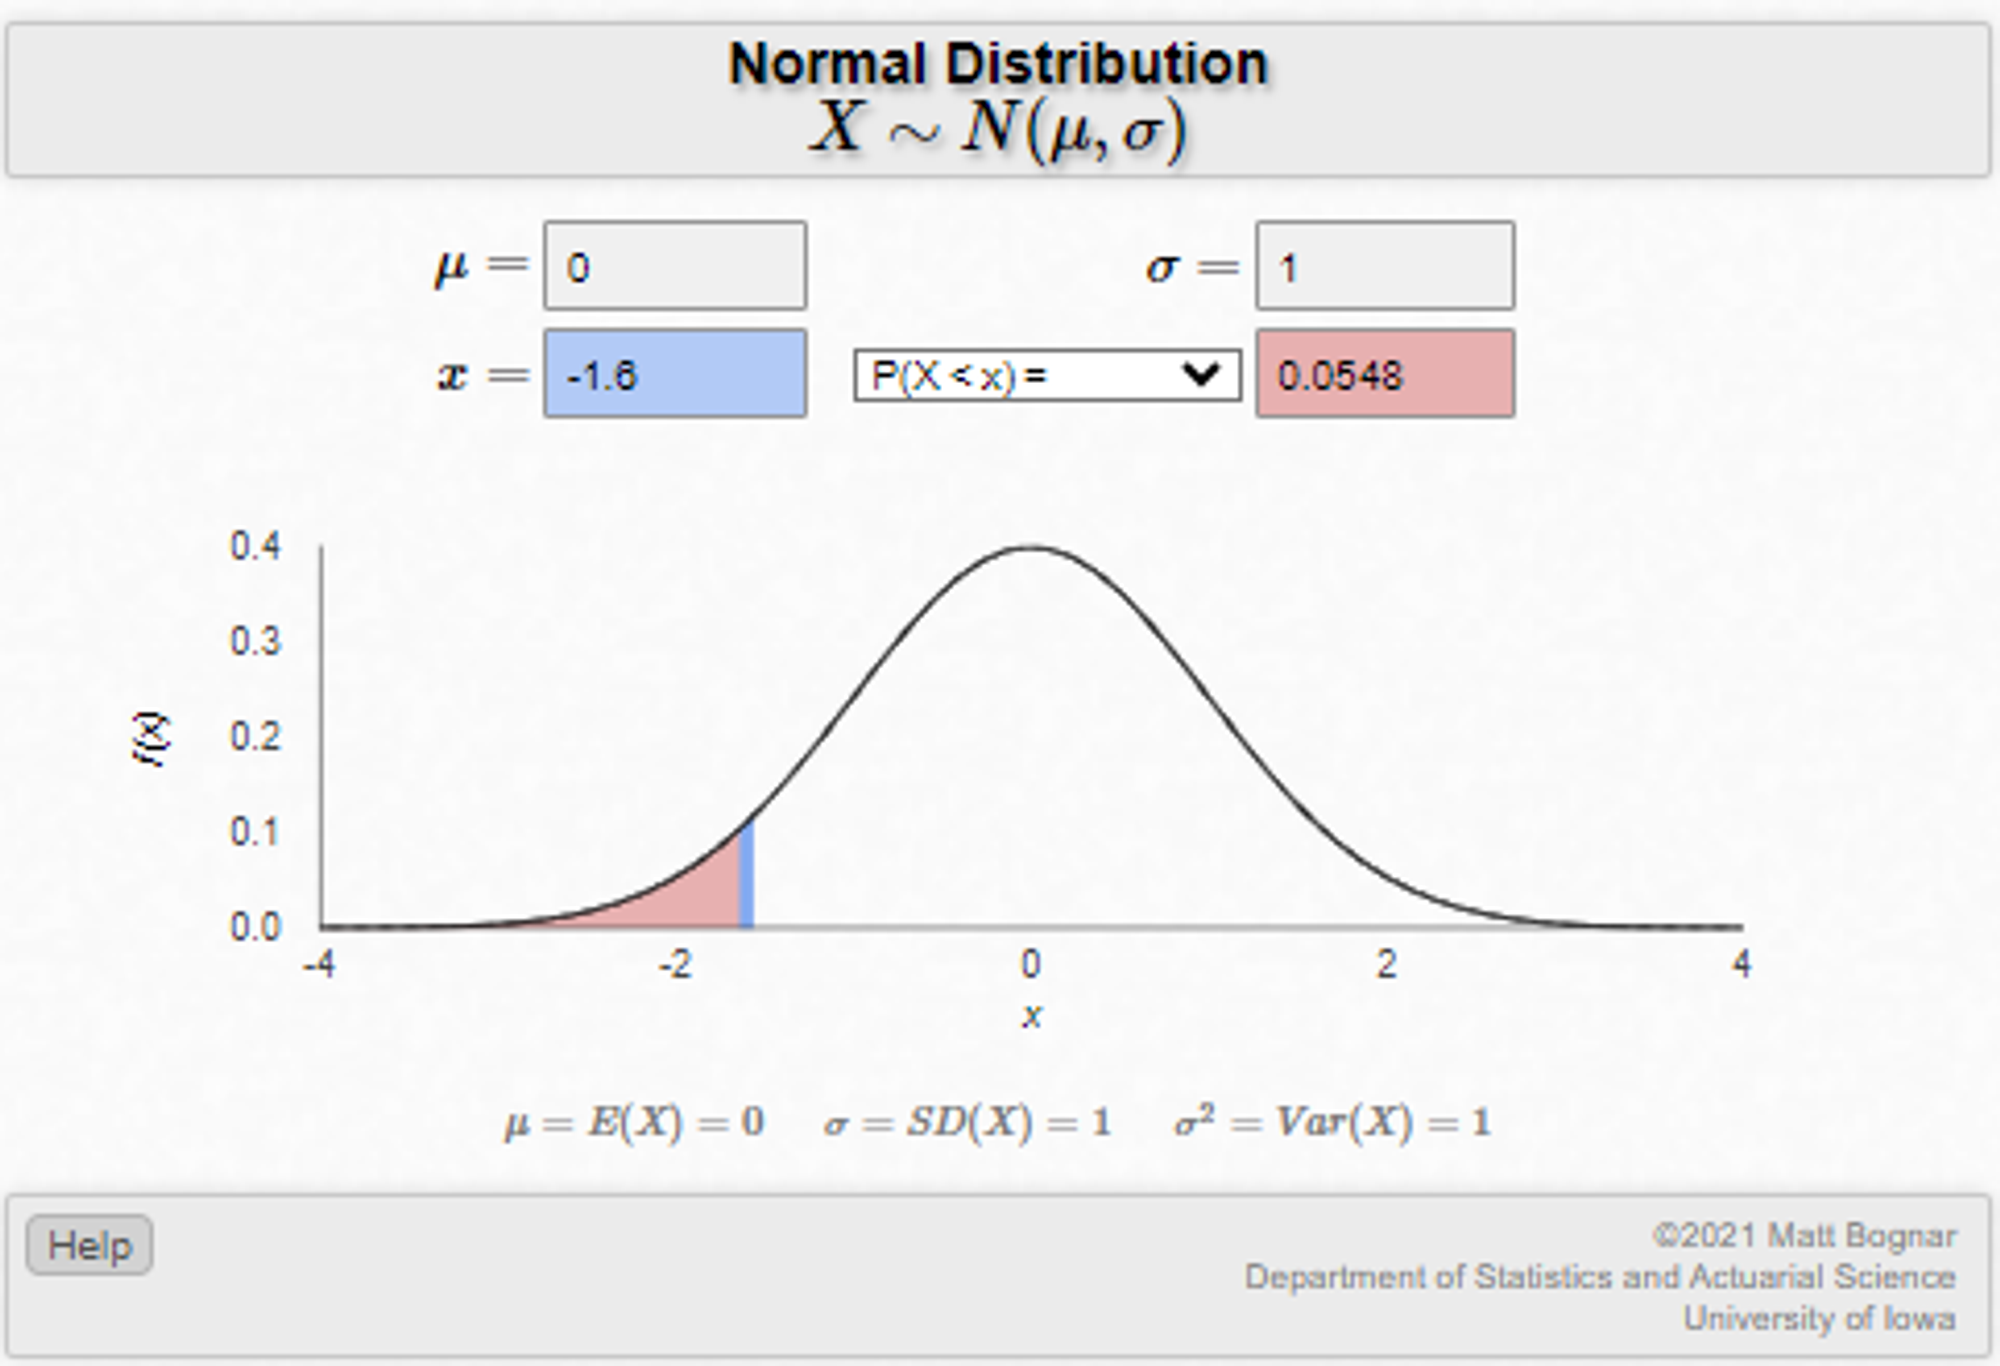
- A straddle (ie MAD) understates risk in the presence of skew If the straddle or MAD is $7.50, then as we established earlier that maps to a volatility of 9.375%. Balanced case The stock dropping $15 is impossible (we set up a binary). The $10 put is worthless. Now relax the binary. The balanced stock dropping $15 is a 1.6 standard deviation move. [The z-score: -15%/9.375% = -1.6] The probability of that is 5.5%

The 90-strike put has some value now. Plugging into an option calculator with 1 day to expiry and 148% annualized vol I get a value of $.29
Skewed case
In the skewed case, remember we can’t see the skew. We still just see the $7.50 straddle and if we use the vol implied from that we will think the option is worth $.29.
But we stipulated that the hidden binary distribution has a 25% chance of the stock dropping to $85 giving that put a true value of $1.25 (25% x $5)
This is concerning even if you don’t trade options but use the straddles to imply a standard deviation, perhaps for vol-weighted position sizing.
For the same straddle value the balanced stock with the lognormal distribution (remember we relaxed the binary condition) had a 5.5% chance of dropping $15 but the binary skewed stock had a 25% chance.
But both stocks had the same straddle price!