To model the price distribution of a stock, Black Scholes assumes a random walk. For our purpose, the equation detailing the process is not important. It’s sufficient to note that the process has a deterministic component and a random component.
- Drift (deterministic)
This is the expected continuously compounded return of the stock. You might wonder where we get the “expected return”. Like CAPM says the expected return is a function of how volatile the stock is. The more risky, the higher expected return.
The key insight in the arbitrage pricing framework is that in the context of replication, the drift of the stock is assumed to be the risk-free rate. This might sound crazy but the key qualifier is “in the context of replication”.
When you are trying to price an option, you don’t actually care what the expected return is of the stock because you are basing the price on an offsetting strategy that sterilizes the effect of the stock price. If the offsetting strategy matches the profit of the call option, then have constructed a long/short portfolio without risk. The payoff of that portfolio only needs to be discounted by the risk-free rate.
In this replication context, the drift is simply the annualized risk-free rate.
- Distribution (random) While the drift tells us the expected return of the stock, we know that the actual return will be a random distribution centered around the expected return. We assume a lognormal distribution because:
- the returns are compounded
- stock prices are bounded by zero
Volatility (aka standard deviation) tells us how wide the dispersion of returns are around the expected return.
Roughly speaking, if a stock is $100 and has a volatility of 30% and the risk-free rate is 10% then the distribution of stock prices in a year is a mean of $110 give or take 30%.
[This is not mathematically true because of compounding, but the details are a hindrance for this post]
Intuition for the lognormal distribution
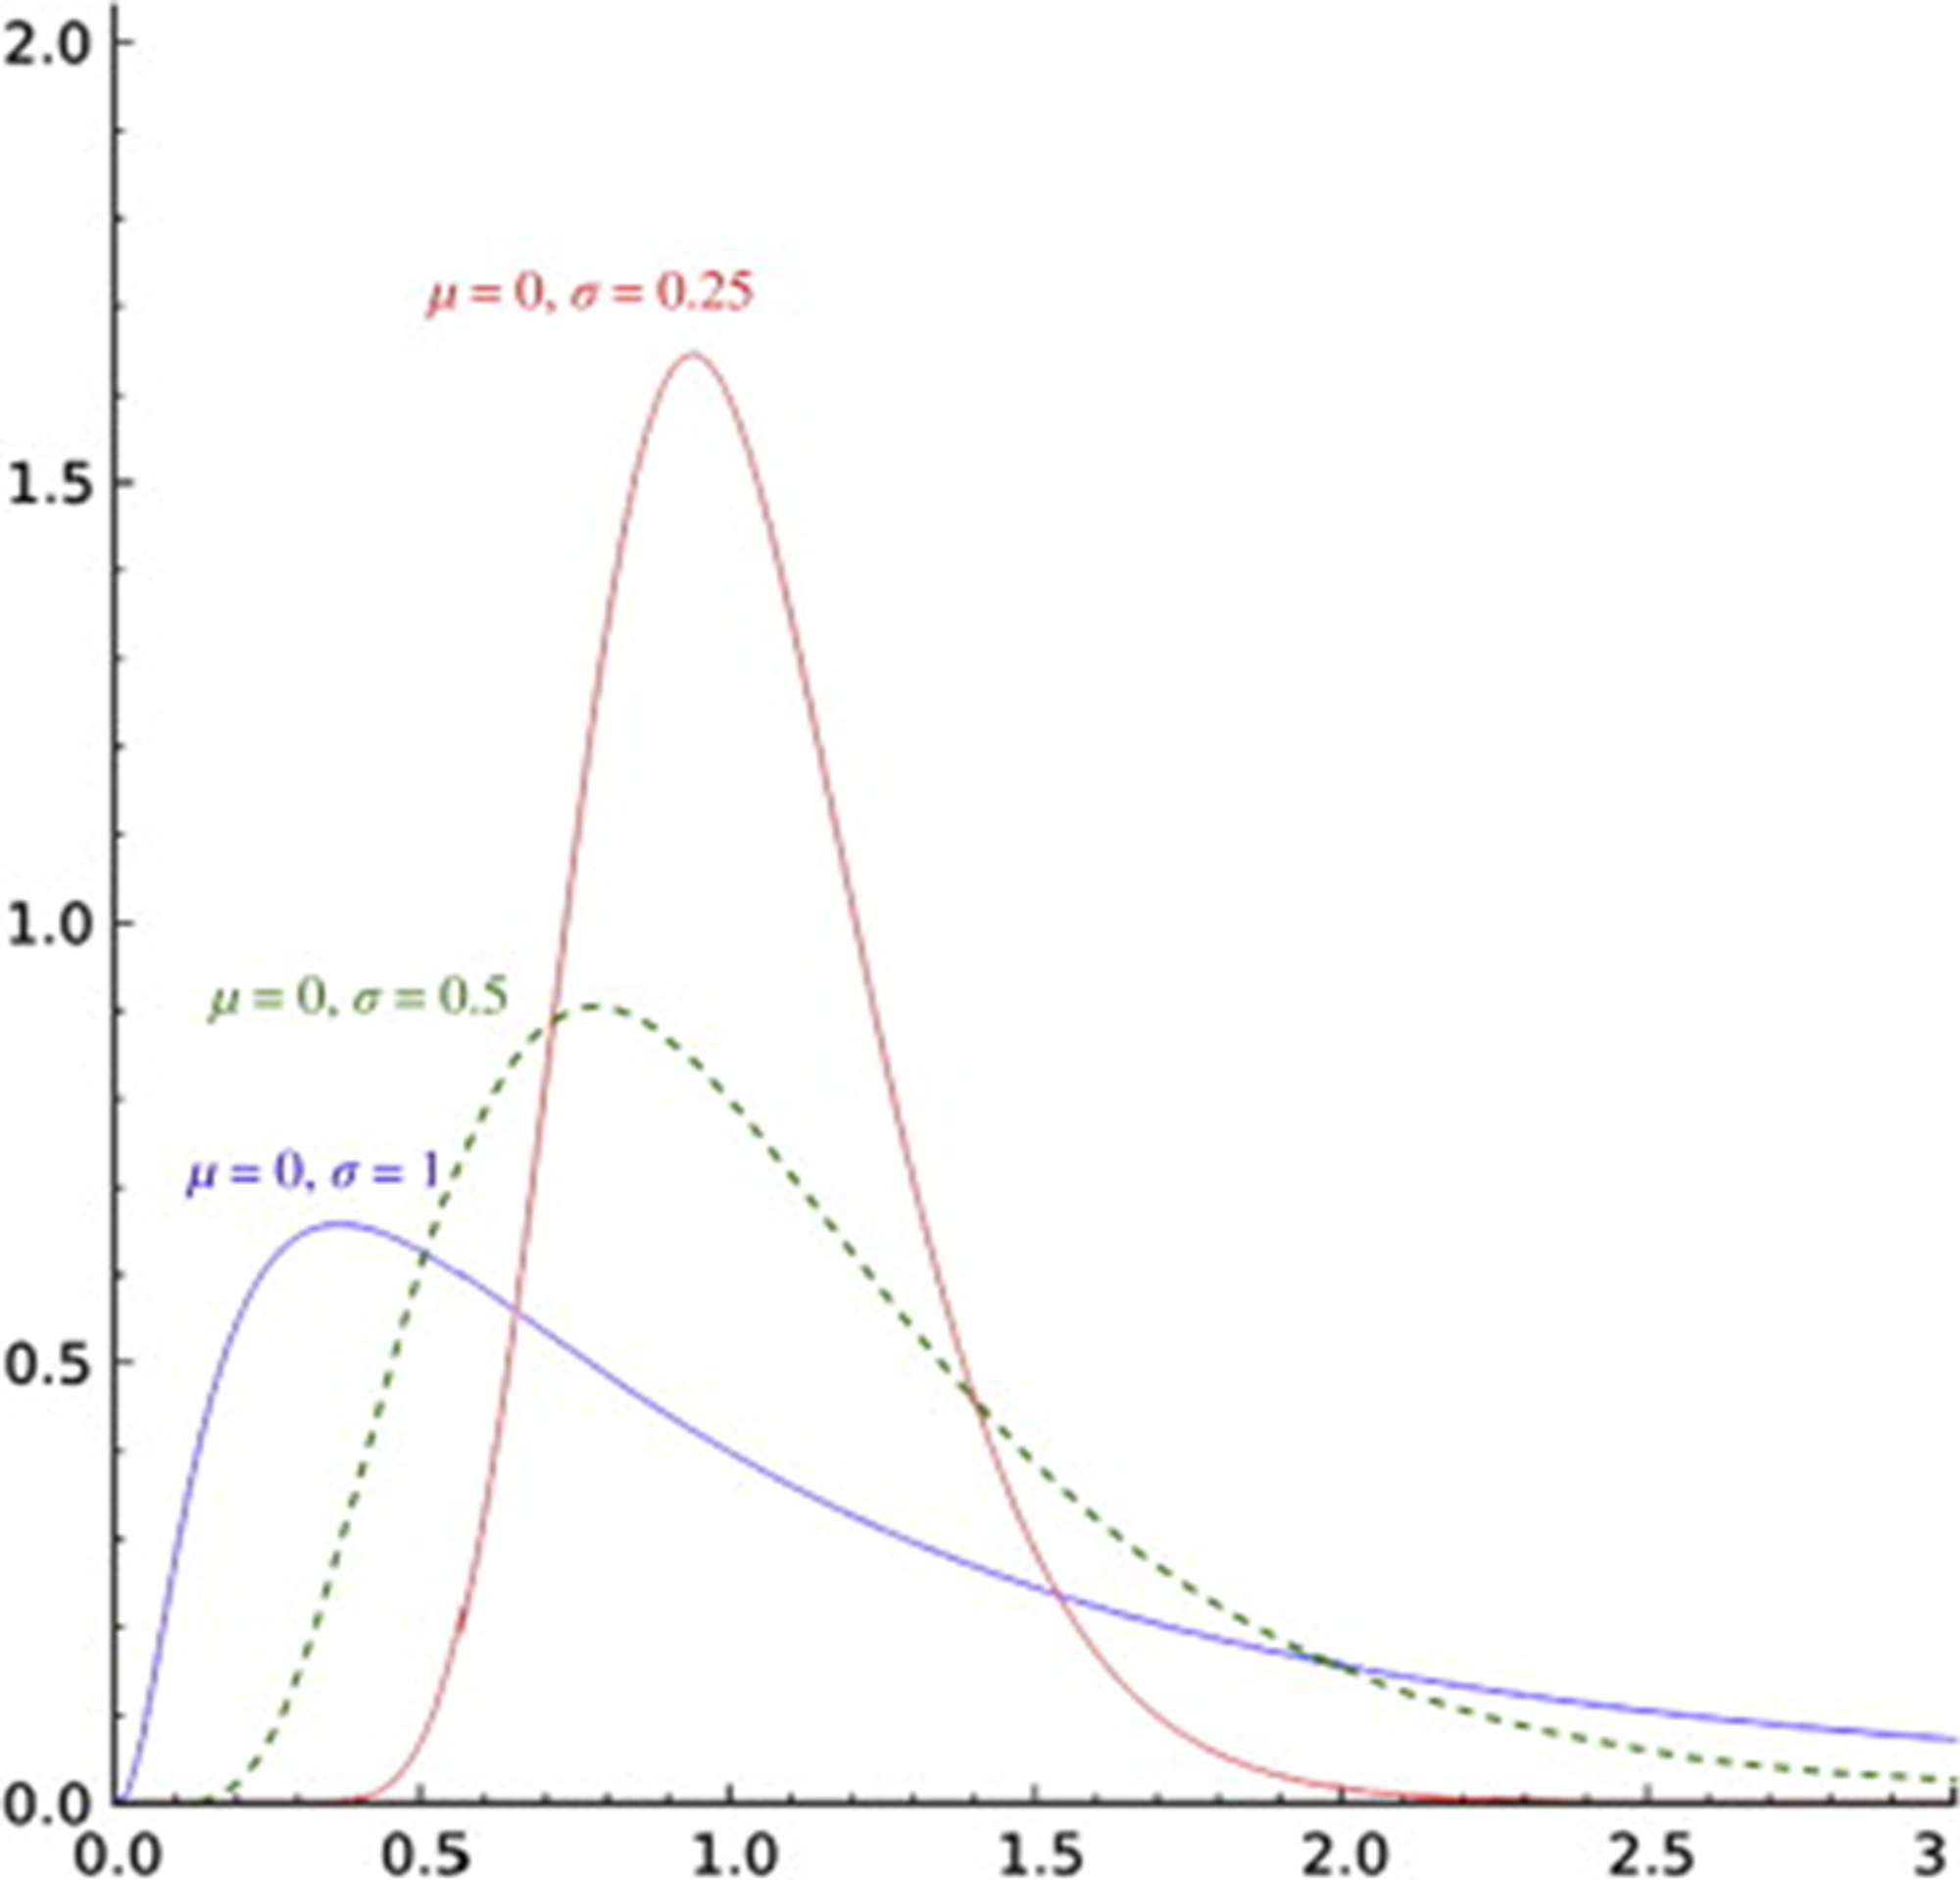
The lognormal distribution looks like a lop-sided bell curve. The higher volatility (or time to expiration) the wider the spread of possible returns.
Since:
- the expected return is only a function of the risk-free rate x time
- the distribution is bounded by zero
the larger the volatility, the more lop-sided or positively skewed the distribution becomes.
Via ScienceDirect:

This makes sense.
The mass or total probability under the curve must still equal 1, but the spread of outcomes is wider (ie the right tail expands)
If the right-tail extends further, but the expected value or stock price is unchanged then the probability of the stock falling must be increasing to counterbalance the bigger upside.
This is a well-understood property of compounded returns. Google “ergodicity” or see The Volatility Drain
This idea will reappear later in an important way.